
Disclaimer: Custom metrics are $0.50 USD a month. Use judiciously.
I want to be able to set alarms when nodes are getting memory starved and to analyze memory trends. Doing this for disk space, heap space, etc is a simple modification of the below tutorial.
Since the AWS docs have no complete example on how to do this, I wanted to provide one. I set this up using nothing but bash and cron (other examples use Python). My goal was a very simple example.
1. Create a new Metric
We’ll skip this since by virtue of putting data into your new metric, CloudWatch will create it for you.
2. Get the free memory
Folks will tell you of vmstat, free, and other utilities, but if you read their man files, you’ll see the value comes from /proc/meminfo, so go to the source. Let’s grep it out of there:
FREE_MEM_KB=$(egrep -o "MemFree:\s*([0-9]*)" /proc/meminfo | egrep -o "[0-9]*")
echo $FREE_MEM_KB
The gist is that we cannot access capture groups directly in egrep, but we can hit it twice with a pipe for the same effect. The -o is used to only return the matching fragment.
3. Pick a Good Name
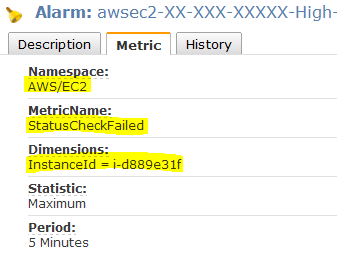
I found the terms used in the CloudWatch docs a little confusing at first, so here it how to find them. Check on any of your metrics in the AWS CloudWatch Console as shown below:
Namespace
There are existing namespaces like AWS/EC2 and AWS/RDS. Don’t set metrics here, these are for AWS only. Make up a new namespace for your metric like “MySite.”
MetricName
A short descriptive name, preferentially CamelCase. Remember, you cannot delete or change it! Think hard. Note the metric will be expelled after two weeks of disuse.
Dimensions
Let’s say you’ve got a FreeMemory metric in your MySite namespace. What if you want to add this to another instance? You need yet another degree of freedom, Dimensions. In this example the InstandId is the dimension being used, but you can set others if you like.
4. Send it to CloudWatch
Make sure you’ve installed the CloudFront Commandline Tools. The README.txt explains it all quite well.
Now just fire away:
FREEMEMKB=$(egrep -o "MemFree:\s*([0-9]*)" /proc/meminfo | egrep -o "[0-9]*")
echo `mon-put-data --namespace="MySite" --metric-name=FreeMemory --dimensions="InstanceId=i-d889e31d" --unit=Kilobytes --value=$FREEMEMKB`
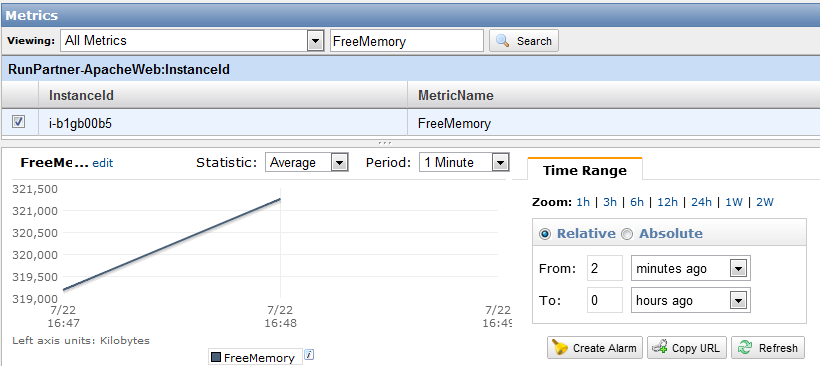
As you can see, we just specify the three degrees of freedom, the units, and the value. Done! And look, we just ran it twice and we’ve already got a chart. Amazon says it can take 15min to see your new metric and 2min to see a new data value. I found these to all happen within a minute, but depends on the ambient CloudWatch load.
Script It
If found the my variables were not always available to my cron user, so I put them in the bash file (below).
#setup variables
export AWS_CLOUDWATCH_HOME=/home/myuser/cloudwatch/CloudWatch-1.0.12.1
export JAVA_HOME=/usr/lib/jvm/jre1.6.0_33
export AWS_CREDENTIAL_FILE=$AWS_CLOUDWATCH_HOME/credential-file-path.template

# get free memory and send to AWS CloudWatch
FREEMEMKB=$(egrep -Eio "MemFree:\s*([0-9]*)" /proc/meminfo | egrep -Eio "[0-9]*")
echo `/home/myuser/cloudwatch/CloudWatch-1.0.12.1/mon-put-data --namespace="MySite" --metric-name=FreeMemory --dimensions="InstanceId=i-d889e31d" --unit=Kilobytes --value=$FREEMEMKB`
And just added the line to the cron file. Note the full paths given since cron does not know these.
# Update AWS custom metric monitors every minute
*/1     *       *       *       *       /home/myuser/scripts/cloudfront_update_metrics.sh
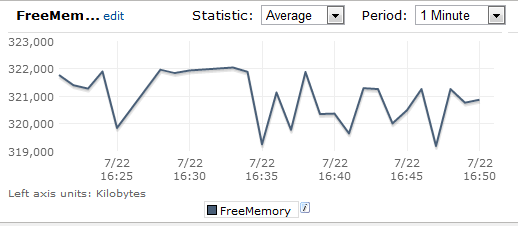
Now enjoy the pretty charts! And set your alarms as needed at a given low memory threshold.