This is a collection of Dynatrace actions I’ve learned to avoid. I’ll add more as my Dynatrace journey evolves.
Judiciously Apply Memory Sensors
If one Memory Sensor is good, then many must be great? Sadly not. Memory sensors are useful as they allow Selective Memory Snapshots to be taken of a subset of the heap graph without taking an entire heap dump. They are delightfully fast and light, but too many will spoil the party.
Any scientific instrument will perturb the system under measure during the act of mensuration. With Dynatrace, applying Memory Sensors to core services (singletons) only incurs an ~1ms increase in initialization due to byte code instrumentation and is not a problem. However, if the instrumented object is a core type which is created and garbage collected often, the effects can be shocking.
Let’s look at adding memory sensors to two core types in my application, LocalDate and Money. The application was creating millions of date objects for a certain batch job as well as money objects. I wanted to see how much heap was consumed by them, so I instrumented these objects with Memory Sensors. Suddenly, the application began to crawl.
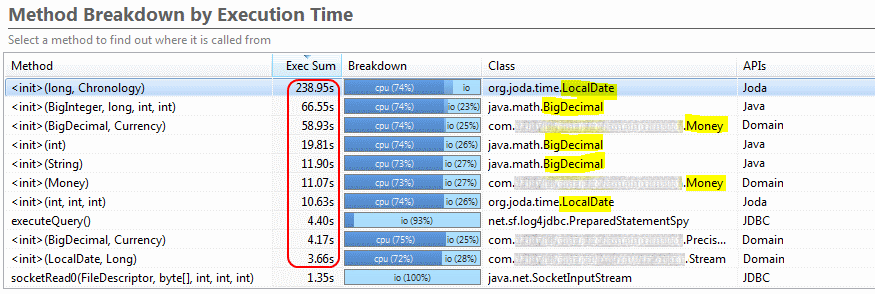
Below we see the new application Hot Spot Methods. The init of LocalDate objects takes nearly 4 minutes. Similarly the BigDecimals inside the Money objects are consume an inordinate amount of time. This job is a database bound job, but here we see the database calls are only 0.3% of the hot spot methods. The Dynatrace instrumentation of these memory sensors is to blame, which might be a surprise as the memory sensors are not even creating Pure Paths and we’re not taking any Selective Memory Snapshots.

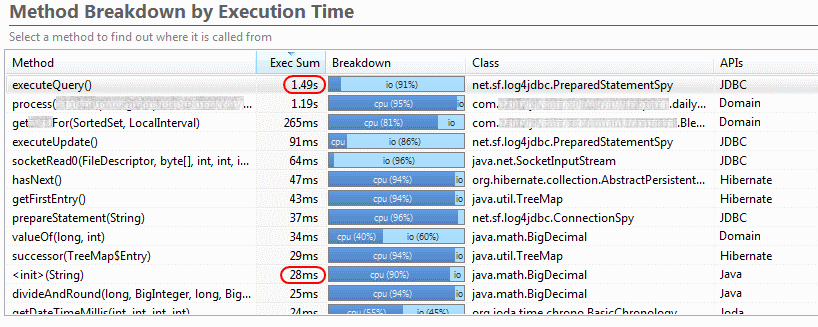
After the Memory Sensors are removed, we see that query execution dominates the job runtime, as expected. We also see that LocalDate instantiation has dropped from 4 minutes to 20ms (too small to appear in Hot Spots report below). The moral of the story? The Memory Sensors on LocalDate increased it’s initialization time 12,000 times!

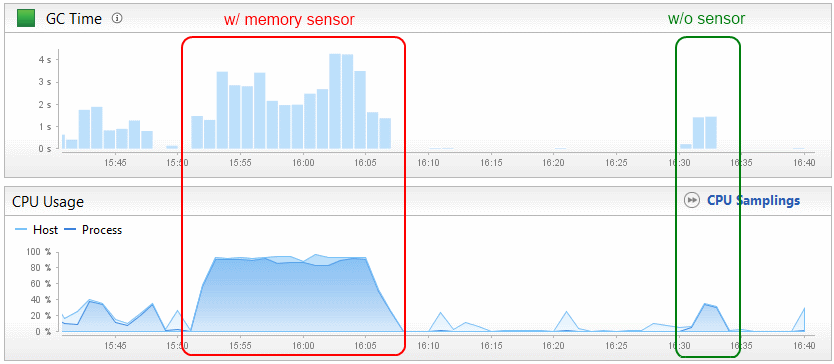
The CPU and garbage collection times were also dilated notably by the wanton application of Memory Sensors. Below we can see that GC time is magnified ~14x and CPU consumption more than doubled to 93% from 41%. Note that the Memory Sensor case below is truncated as the sensors were removed via Hot Placement during the job, otherwise it would ostensibly have taken forever to run.

The moral of the story? Always instrument the bare minimum necessary items with Dynatrace. All measurements have overhead and perturb the code under test. The greater the instrumentation, the greater the perturbation. You want to be confident that the trends you discover in Dynatrace are due to the code under test, rather than an artifact of the instrumentation.
