

Debugging Apache Spark can be tricky. Sure, everything works on your --master local[4] cluster, but not when run on a real cluster. In these cases, you need to drop to a debug breakpoint in the running cluster.
Get Debugger Listening
Simply update the launch args wherever you start Spark like so. Note: SPARK_JAVA_OPTS won’t do the trick.
  export SPARK_WORKER_OPTS="-Xdebug -Xrunjdwp:server=y,transport=dt_socket,address=4000,suspend=n"
  export SPARK_MASTER_OPTS="-Xdebug -Xrunjdwp:server=y,transport=dt_socket,address=4000,suspend=n"
  /opt/spark/sbin/start-master.sh
Open an SSH tunnel to your remote cluster machine, mapping localhost:4000 to spark-master.foo.com:5000, assuming the cluster is at spark-master.foo.com, listening on port 5000.
ssh -L localhost:5000:spark-master.foo.com:4000 you@spark-master.foo.com
Now Eclipse will think you’re just debugging a local Spark process.
Set Eclipse Breakpoint
Let’s checkout the Spark source and set that breakpoint. Let’s say you want to sniff around the Spark Master when a Worker gets disconnected, in release v1.6.0.
git clone https://github.com/apache/spark.git
git checkout v1.6.0
Now import the Spark core module into ScalaIDE. There are a lot of modules, you only need spark-core.
Set your breakpoint and create a Remote Java Application debugger config as shown below.
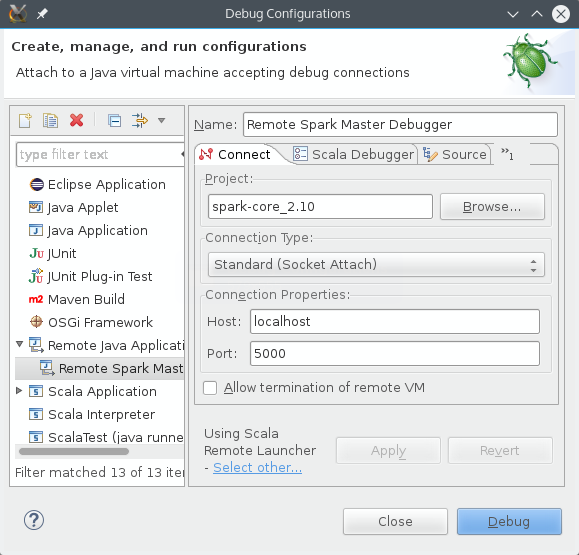
ScalaIDE Debugger Configuration
That’s it! Now you can debug on your live cluster as if it were your desktop.